Texas's 3rd congressional district
| Texas's 3rd congressional district | |
|---|---|
 District map | |
| Representative | |
| Distribution |
|
| Population (2023) | 872,647[2] |
| Median household income | $118,298[2] |
| Ethnicity |
|
| Cook PVI | R+11[3] |
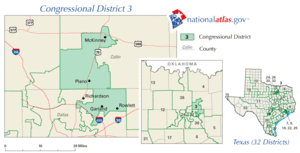
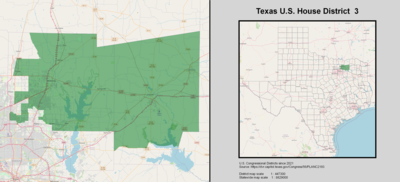
Texas's 3rd congressional district of the United States House of Representatives is in the suburban areas north and northeast of Dallas. It encompasses much of Collin County, including McKinney and Allen, as well as parts of Plano, Frisco, and Prosper. Additionally, the district includes all but the southern portion of Hunt County. The district is also home to a public four-year university, Texas A&M University-Commerce, as well as Collin College.
Texas has had at least three congressional districts since 1869. The current seat dates from a mid-decade redistricting conducted before the 1966 elections after Texas's original 1960s map was thrown out by Wesberry v. Sanders. In past configurations, it has been one of the most Republican districts in both Texas and the Dallas–Fort Worth metroplex. The GOP has held the seat since a 1968 special election. The district's current congressman is Keith Self.
As of the 2010 census, the 3rd district represents 765,486 people who are predominantly middle-to-upper-class (median family income is US$80,912). The district is 59.1 percent White (non-Hispanic), 15.06 percent Hispanic or Latino (of any race), 13 percent Asian, and 8.9 percent Black or African American.[4]
From 1967 to 2013, the district included large portions of Dallas County. Eventually, the 3rd covered much of northern Dallas County, including Garland, Rowlett and much of northern Dallas itself. It was pushed into Collin County in 1983. Since then, Collin County's rapid growth resulted in the district's share of Dallas County being gradually reduced. After redistricting in 2012, the Dallas County portion of the district was removed altogether. However, it still includes the Dallas precincts located in Collin County.[5]
2021 redistricting
[edit]From 2013 to 2021, the district represented suburban areas north and northeast of Dallas. It encompassed much of Collin County, including McKinney, Plano, and the majority of Frisco, as well as a portion of the city of Dallas. The district was also home to the public college Collin College, and the Frisco campus of the University of North Texas.
After redistricting in 2021, the Dallas and Richardson portions of the district were removed, as well as much of Plano and Frisco. The Richardson portion of the district was transferred to District 32, while the Plano, Dallas, and Frisco portions were given to District 4. In return, District 3 was expanded eastward to encompass most of Hunt County.[6]
Recent election results from statewide races
[edit]| Year | Office | Results[7] |
|---|---|---|
| 2008 | President | McCain 66% - 34% |
| 2012 | President | Romney 69% - 31% |
| 2014 | Senate | Cornyn 74% - 26% |
| Governor | Abbott 70% - 30% | |
| 2016 | President | Trump 60% - 34% |
| 2018 | Senate | Cruz 57% - 42% |
| Governor | Abbott 63% - 35% | |
| Lt. Governor | Patrick 59% - 39% | |
| Attorney General | Paxton 57% - 40% | |
| 2020 | President | Trump 56% - 42% |
| Senate | Cornyn 59% - 38% | |
| 2022 | Governor | Abbott 59% - 39% |
| Lt. Governor | Patrick 58% - 40% | |
| Attorney General | Paxton 57% - 39% | |
| Comptroller of Public Accounts | Hegar 62% - 36% |
Composition
[edit]For the 118th and successive Congresses (based on redistricting following the 2020 census), the district contains all or portions of the following counties and communities:[8]
Collin County (30)
- Allen, Anna, Blue Ridge, Celina (part; also 4th and 26th), Dallas (part; also 4th, 5th, 6th, 24th, 30th, 32nd, and 33rd; shared with Dallas, Denton, Kaufman, and Rockwall counties), Fairview, Farmersville, Frisco (part; also 4th and 26th; shared with Denton County), Josephine (shared with Hunt County), Lavon, Lowry Crossing, Lucas, McKinney (part; also 4th), Melissa, Murphy, Nevada, New Hope, Parker, Plano (part; also 4th, 26th, and 32nd; shared with Denton County), Princeton, Prosper (part; also 4th and 26th, shared with Denton County), Royse City (part; also 4th; shared with Hunt and Rockwall counties), Sachse (part; also 5th; shared with Dallas County), Seis Lagos, St. Paul, Trenton (part; also 4th; shared with Fannin County), Van Alstyne (part; also 4th; shared with Grayson County), Westminster, Weston, Wylie (part; also 5th; shared with Dallas County)
Hunt County (12)
- Caddo Mills, Campbell, Celeste, Commerce, Greenville, Josephine (shared with Collin County), Lone Oak, Neylandville, Quinlan (part; also 4th), Royse City (part; also 4th; shared with Collin and Rockwall counties), Union Valley, Wolfe City
List of members representing the district
[edit]Recent election results
[edit]2004
[edit]| Party | Candidate | Votes | % | |
|---|---|---|---|---|
| Republican | Sam Johnson (incumbent) | 178,099 | 85.56 | |
| Independent | Paul Jenkins | 16,850 | 8.10 | |
| Libertarian | James Vessels | 13,204 | 6.34 | |
| Total votes | 208,153 | 100.0 | ||
| Republican hold | ||||
2006
[edit]| Party | Candidate | Votes | % | ±% | |
|---|---|---|---|---|---|
| Republican | Sam Johnson (incumbent) | 88,634 | 62.52 | −23.04 | |
| Democratic | Dan Dodd | 49,488 | 34.91 | +34.91 | |
| Libertarian | Christopher Claytor | 3,656 | 2.58 | ||
| Majority | 39,146 | 27.61 | |||
| Turnout | 141,778 | ||||
| Republican hold | Swing | -23.04 | |||
2008
[edit]| Party | Candidate | Votes | % | ±% | |
|---|---|---|---|---|---|
| Republican | Sam Johnson (incumbent) | 169,557 | 59.80 | −2.72 | |
| Democratic | Tom Daley | 107,679 | 37.98 | +3.07 | |
| Libertarian | Christopher Claytor | 6,300 | 2.22 | −0.36 | |
| Majority | |||||
| Turnout | 283,536 | ||||
| Republican hold | Swing | -2.72 | |||
2010
[edit]| Party | Candidate | Votes | % | ±% | |
|---|---|---|---|---|---|
| Republican | Sam Johnson (incumbent) | 101,180 | 66.28 | +6.48 | |
| Democratic | John Lingenfelder | 47,848 | 31.34 | −3.57 | |
| Libertarian | Christopher Claytor | 3,602 | 2.35 | +0.13 | |
| Independent | Harry Pierce | 22 | 0.01 | ||
| Majority | |||||
| Turnout | 152,652 | ||||
| Republican hold | Swing | +6.48 | |||
2012
[edit]| Party | Candidate | Votes | % | |
|---|---|---|---|---|
| Republican | Sam Johnson (incumbent) | 187,180 | 100.0 | |
| Total votes | 187,180 | 100.0 | ||
| Republican hold | ||||
2014
[edit]| Party | Candidate | Votes | % | |
|---|---|---|---|---|
| Republican | Sam Johnson (incumbent) | 113,404 | 82.0 | |
| Green | Paul Blair | 24,876 | 18.0 | |
| Total votes | 138,280 | 100.0 | ||
| Republican hold | ||||
2016
[edit]Adam P. Bell was the first Democrat to run for Texas's 3rd since the redistricting effort of 2012.
| Party | Candidate | Votes | % | |
|---|---|---|---|---|
| Republican | Sam Johnson (incumbent) | 193,684 | 61.2 | |
| Democratic | Adam P. Bell | 109,420 | 34.6 | |
| Libertarian | Scott Jameson | 10,448 | 3.3 | |
| Green | Paul Blair | 2,915 | 0.9 | |
| Total votes | 316,467 | 100.0 | ||
| Republican hold | ||||
2018
[edit]The incumbent representative, Sam Johnson, decided not to run for reelection in 2018, after having represented Texas's 3rd since 1991. His stated reason for retiring was that "the Lord has made clear that the season of my life in Congress is coming to an end".[13]
| Party | Candidate | Votes | % | |
|---|---|---|---|---|
| Republican | Van Taylor | 169,520 | 54.2 | |
| Democratic | Lorie Burch | 138,234 | 44.2 | |
| Libertarian | Christopher Claytor | 4,604 | 1.5 | |
| Independent | Jeff Simons (write-in) | 153 | 0.1 | |
| Total votes | 312,511 | 100.0 | ||
| Republican hold | ||||
2020
[edit]| Party | Candidate | Votes | % | |
|---|---|---|---|---|
| Republican | Van Taylor (incumbent) | 228,648 | 55.2 | |
| Democratic | Lulu Seikaly | 177,221 | 42.8 | |
| Libertarian | Christopher J. Claytor | 8,567 | 2.0 | |
| Total votes | 414,436 | 100.0 | ||
| Republican hold | ||||
2022
[edit]| Party | Candidate | Votes | % | |
|---|---|---|---|---|
| Republican | Keith Self | 164,240 | 60.5 | |
| Democratic | Sandeep Srivastava | 100,121 | 36.9 | |
| Libertarian | Christopher Claytor | 6,895 | 2.5 | |
| Total votes | 271,256 | 100.0 | ||
| Republican hold | ||||
See also
[edit]References
[edit]- ^ "Congressional Districts Relationship Files (State-based) - Geography - U.S. Census Bureau". Archived from the original on April 2, 2013.
- ^ a b "My Congressional District".
- ^ "2022 Cook PVI: District Map and List". Cook Political Report. July 12, 2022. Retrieved January 10, 2023.
- ^ "My Congressional District". United States Census Bureau. Retrieved July 31, 2015.
- ^ "DistrictViewer". dvr.capitol.texas.gov.
- ^ "DistrictViewer". dvr.capitol.texas.gov. Retrieved January 20, 2022.
- ^ https://davesredistricting.org/maps#viewmap::1c2c1e0d-2fd1-43a8-a039-73e7023124d1
- ^ https://www2.census.gov/geo/maps/cong_dist/cd118/cd_based/ST48/CD118_TX03.pdf
- ^ Bland, Scott; Cheney, Kyle (January 6, 2017). "Texas Rep. Sam Johnson announces he won't run for re-election". Politico. Retrieved August 8, 2017.
- ^ "District Population Analysis with County Subtotals | CONGRESSIONAL DISTRICTS - PLANC2100" (PDF). Capitol Data Portal. Texas Legislative Council. August 26, 2021. Archived (PDF) from the original on June 27, 2022. Retrieved January 1, 2023.
- ^ "District Population Analysis with County Subtotals | CONGRESSIONAL DISTRICTS - PLANC2193" (PDF). Capitol Data Portal. Texas Legislative Council. October 17, 2021. Archived (PDF) from the original on December 25, 2022. Retrieved January 1, 2023.
- ^ a b c d e f "Texas Election Results". Texas Secretary of State. Retrieved December 5, 2018.
- ^ Leslie, Katie (January 2017). "Plano Rep. Sam Johnson to retire when term ends in 2018". The Dallas Morning News. Retrieved July 2, 2019.
- Martis, Kenneth C. (1989). The Historical Atlas of Political Parties in the United States Congress. New York: Macmillan Publishing Company.
- Martis, Kenneth C. (1982). The Historical Atlas of United States Congressional Districts. New York: Macmillan Publishing Company.
- Congressional Biographical Directory of the United States 1774–present
- Texas Secretary of State 2010 General Election Statewide Race Summary

